Growing up in California, I always knew what the weather was going to be like. It would be exactly the same as yesterday. After moving to the east coast, the weather became a focal point of my life and since most kids have an interest in nature and the weather, we came up with this simple weather tracking activity!
At some point, every parent has had the preschool weather song, "What's the weather... what's the weather... what's the weather like today?" stuck in their heads. Our weather tracking activity turned that song from a glance out the window into a scientific study of temperature patterns over the course of a month.

Prepare for the Activity
The weather and temperature tracking experiment is and easy science project to do at home, and makes checking the daily temperatures fun! The good news is that you don't need a pre-prepared weather tracking worksheet. Your child will make their own!
Materials
Graph paper
Ruler
Two different colored markers. We used red and blue.
A black marker.
Tape or pushpins. I recommend painter's tape as it won't ruin your walls.
Make the weather tracker
Use a ruler and the black marker to draw a straight line along the bottom of the graph paper (the x-axis), leaving room for a row of numbers below.
Next, draw a straight line from the left hand corner of the x-axis to the top of the paper (the y-axis).
Label the x-axis with numbers 1-30 or 1-31, depending on the month (you know the drill for February).
Label the y-axis with numbers for the temperature. Your starting number will depend on the month and whether you are using Fahrenheit or Celsius. For example, if it's July in Hawaii and you're recording Farhenheit, you might start with 60, if it's January in Finland and you're using Celsius, you might start with -30.
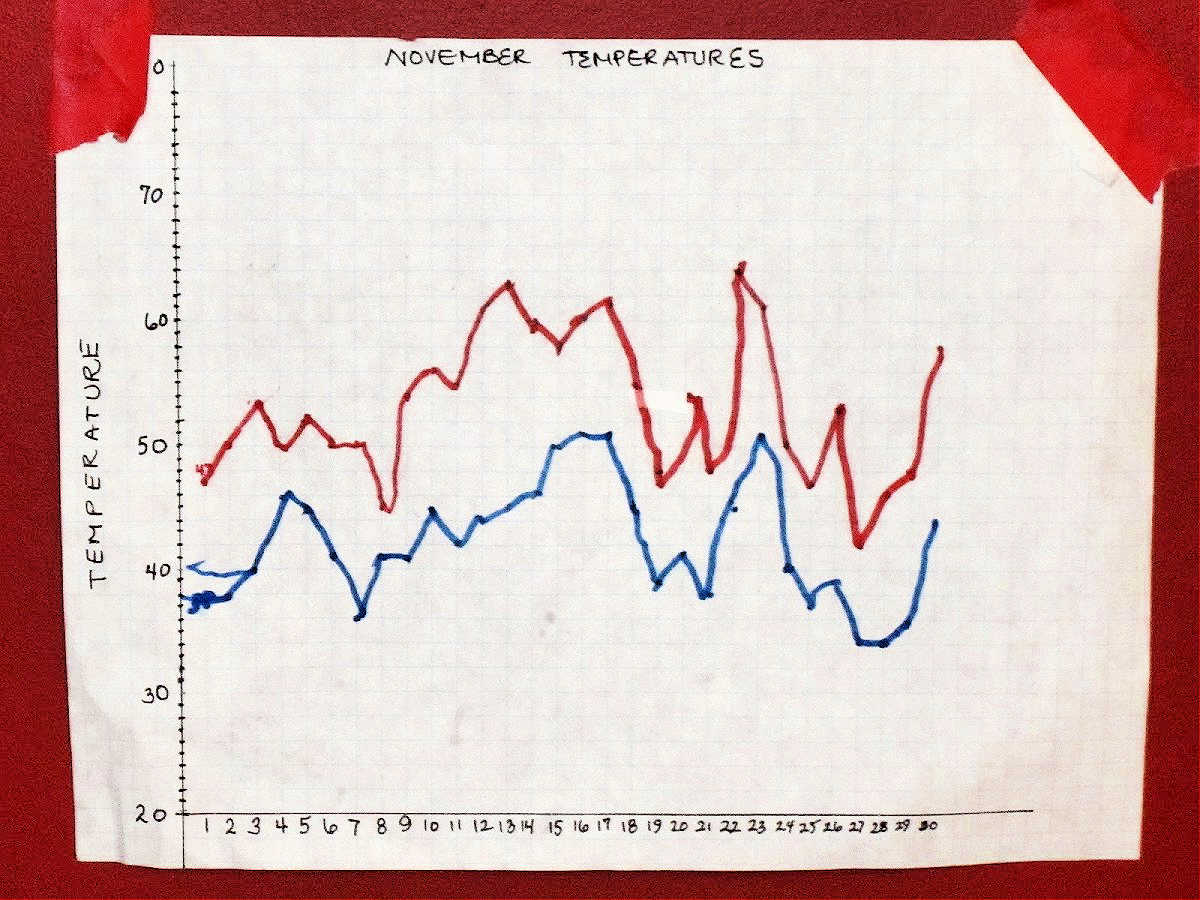
We tracked the weather in November in New York, so it made sense to have a range from 20 to 70 degrees F.
Finally, with tape or pushpins, tack the graph to the wall in a convenient location.

Weather Tracker Instructions
Now that you've made your weather tracker, it's time to record the temperatures.
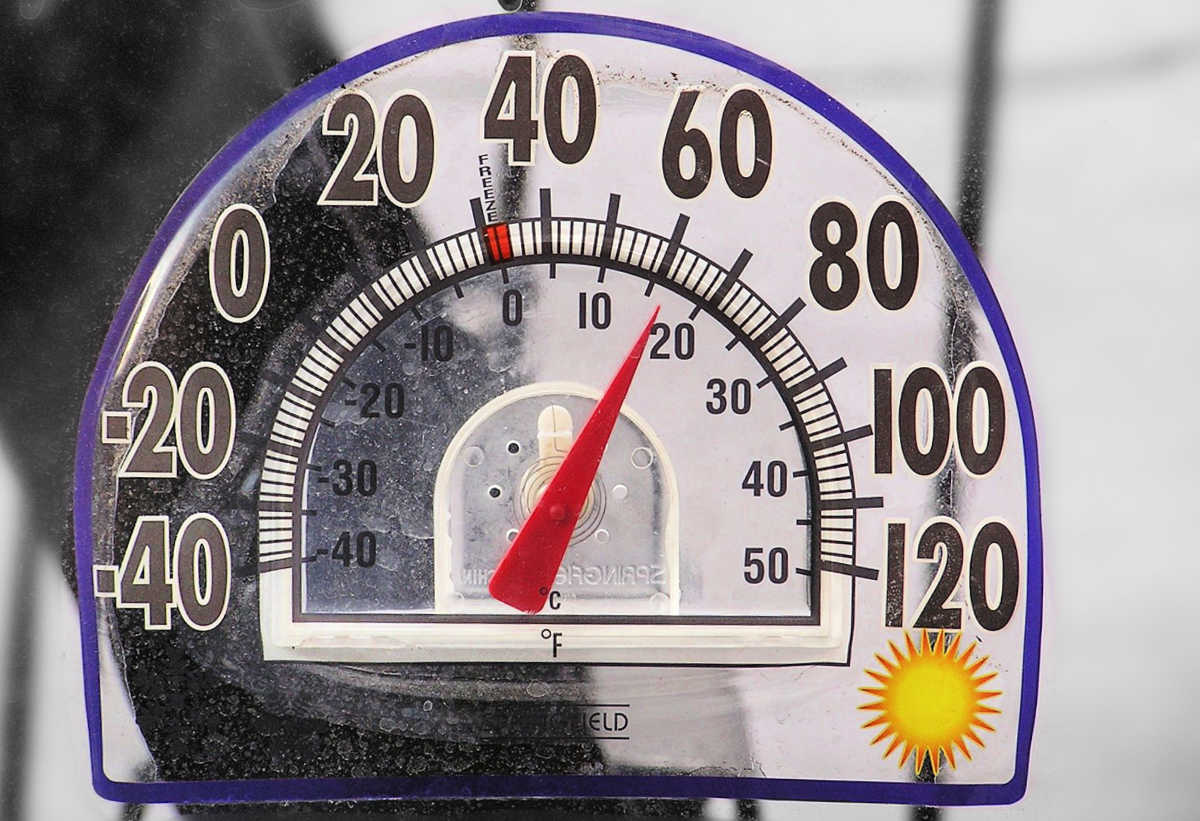
Every morning, with your child, check the previous day's temperature. You can do this online, with a weather app, or on a news program. We have a thermometer on our window. It's fun to notice the temperatures during the day, but it's not an accurate way to get a reading.
Next, record the daily high and daily low on your weather graph. Plot the high with your red pen and the low pen by placing a dot at the point where the values of the date (x-axis) and temperature (y-axis) meet. (Use a non-bleeding pen if you are concerned about accidentally marking up the wall.)
After the first day, you'll be able to start to connect the points on the graph with a line. By the end of the month, your child will be able to observe the fluctuations in temperature over the course of the month!
Variations
There are a number of ways to make this temperature tracking activity more advanced, involving math practice, including the following:
- calculate the difference in high and low temperature every day
- track the discrepancy between the predicted and the actual temperatures
- calculate the change in temperature from one day to the next
- calculate the average high and the average low temperature
In addition, little weather scientists may enjoy recording weather patterns, like whether or not it was sunny, cloudy, rainy, etc.
Idea first published 2011, updated 2023.


MaryAnne says
This is a great idea! I've been thinking I should do more weather-oriented activities with the kids...
Raising a Happy Child says
Anna's class does weather tracking in school, and her teacher calculates an average temp for them. Anna finds a concept of averages very fascinating. I find it fascinating that she understands Fahrenheits - we are still operating in Celsius at home.